Decarbonization Strategy for Existing Commercial Buildings

Image courtesy of “We Are Making Progress Toward Decarbonization—And Every Decision Matters” by Daniel Overbey via www.buildingenclosureonline.com
The recently passed Inflation Reduction Act includes financial incentives for commercial and multi-family building owners to reduce energy costs and carbon emissions. Such incentive programs are well known for their complexity, so what will it be like this time?
Fortunately, there is a very simple approach to providing the required anticipated energy savings using approved DoE calculation methodology employed by highly skilled, specially trained energy auditors.
The inclusion of new and existing commercial buildings in the IRA establishes tax credits and rebates for energy conservation measures implemented by commercial building owners, including multifamily residential buildings.
Specifically, Tax Credit 179D provides deductions for lighting, HVAC and envelope improvements and is based on the impact of the improvement when compared with baseline performance, as stated by ASHRAE 90.1.
These comparisons can be made by providing historical energy data or by estimates supplied by a qualified third party using DOE-approved software to demonstrate a 50 percent energy reduction when compared with ASHRAE 90.1. The compliance path breaks down the contribution to energy conservation made by individual components, including Building Envelope at 10 percent reduction, HVAC and Hot Water at 15 percent reduction and Lighting at 25 percent reduction. The specific savings requirements are identified in IRS notice 2012-26. The tax deduction itself provides a credit based on the building’s square footage and is applicable to activity undertaken in a specific tax year.
Where’s the Catch?
The tax and credit formula is complicated further by the requirement to utilize only those calculators approved by the DOE. It’s been my experience over the past 40 years of involvement in the construction products industry and building science educating that a group of well-meaning engineers and building science practitioners can quickly get in the weeds and overcomplicate matters.
However, is that really necessary here? It’s a top-down approach to concept delivery that limits the involvement of the very people we are seeking to get involved. An example may be found with the delivery of WUFI calculations. A very valuable learning – heat and moisture movement and control within wall assemblies – is underused because of its complexity. Many individuals “run” the WUFI calculation, but only a handful of them have the skills to interpret the results. We must avoid creating the same scenario with this building envelope energy efficiency opportunity.
As an Energy Conservation Measure, the DOE conducted studies1 that predicted annual heating and energy cost savings between 2 and 36 percent, with the highest value in high heating degree-day climates. As an example, in one Toronto 10-story building, infiltration would be responsible for 31-46 percent of the average peak heating load, according to the report. The need is obvious, but how do we quantify the value (savings) for the building owner?
The methodology to provide actual air infiltration/exfiltration data in the residential market is well established through RESNET and other agencies utilizing test methods ASTM E1827-11(2017) and E779. For larger commercial buildings, ASTM E3158-18 is the method of choice.
While these test methods determine the air leakage rate of the envelope, they do not identify the location of the leak. They are also complex and require highly trained individuals and sophisticated equipment to conduct the test. Air exchange rate testing has become a requirement in many State Building Codes – for new construction. Nevertheless, what about existing structures?
As the demand for energy reduction and reduced environmental impact now extends to large commercial structures, the obvious extension of blower doors from our residential experience also exists. This presents another layer of complexity, and calculations and interpretations that are far more detailed – and you still don’t know where the leaks are. In summary, we are increasing the complexity of the analysis, increasing the cost and impact on the business, while limiting the number of people and entities with the training and skills to conduct the testing. In addition, you still don’t know where the leaks are.
You Have to Know Where the Holes Are
We’ve been down this road before, but only a few of us can recall the events of the energy crisis in the ’80s. At that time, leading building science practitioners and keen engineers worked with Ontario Hydro, a major utility in Ontario, Canada, to create a physical inspection protocol and impact calculator that could estimate a building’s total air leakage – EC 128 was created. The concept was to physically inspect a building envelope and measure each air leakage point (many holes), create an equivalent area factor (single hole) and calculate the savings associated with filling the hole, using HDD and CDD as the driving force. By using this “hands-on” methodology, the auditor “sees” and confirms air leakage by IR thermography, smoke pencils and visual inspection.
What that adds up to is a very simple two-step process: have a specifically trained building envelope auditor identify exactly where the holes are and use a DOE-approved calculator to provide the anticipated energy savings.
Fortunately, that simple approach already exists. Both the calculation method and its accompanying report output have long been accepted by various utilities as more than adequate to meet the requirements of the federal and state rebate/tax credit programs. For example, the Building Envelope Auditing Team program was established to provide auditor training to create a nationwide group of auditors. Those individuals are trained to look for holes in the building envelope and report them—not run a sophisticated modeling program.
The idea behind the BEAT approach is that the sophistication of the process needs to be taken care of before the auditor enters the building. That way it’s easier to create a much bigger auditor workforce. More auditors out selling a simple building envelope audit service can potentially get more building owners to take the first step – given the lower audit price point and the existence of rebate and tax credits.
In summary, these are early days for the Biden energy strategy. Before we go too far down the road of sophisticated analysis and costly evaluations, let’s respect work done in the past by very capable engineers and stay away from overcomplicating things to the point of excluding the people we are trying to include.
By employing the “kiss” principle and a simple, effective level of technology, we can involve more people – drive engagement and employ more people in the energy efficiency space as auditors – and provide building owners with a reasonably priced first step toward decarbonization.
Incentives Are Part of Government Decarbonization Strategy
In 2005, the federal government enacted the 2030 Challenge, which sought to reduce CO2 emissions from federal buildings by 20 percent by 2015. The Biden administration furthered the challenge to include all buildings and set a target of 50 to 52 percent reduction in greenhouse gas emissions by 2030.
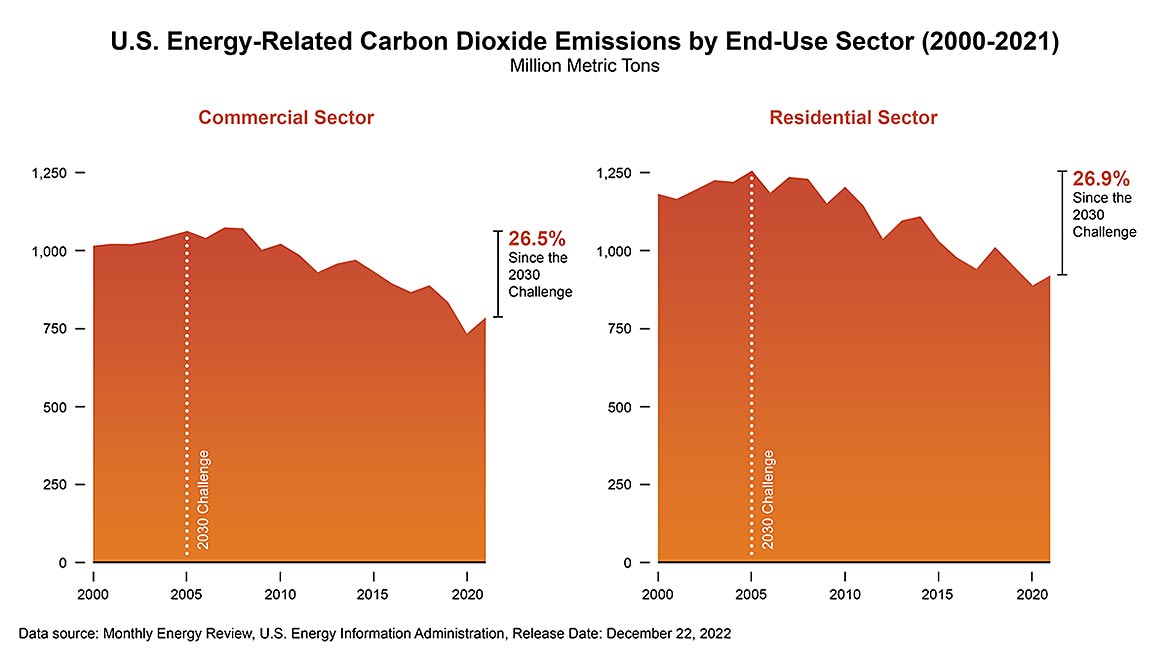 Data source: Monthly Energy Review, U.S. Energy Information Administration, Release Date: December 22, 2022
A closer look at the year-over-year energy related CO2 emissions by sector provides the following conclusions for the year 2021, as provided by the U.S. Energy Information Administration website.
As a result of these short- and long-term factors, U.S. energy-related CO2 emissions increased across all sectors, although in each of these sectors, emissions remained below 2019 levels:
Transportation sector emissions increased by 11 percent, or 185 MMmt, due to increased travel.
- Commercial sector emissions increased by 7percentpercent, or 50 MMmt, resulting from both a change in the electricity fuel mix and an increase in commercial activity.
- Residential sector emissions increased by 4 percent, or 36 MMmt, mostly from changes in the electricity fuel mix.
- Industrial sector emissions increased by 4 percent, or 54MMmt, due to an increase in industrial activity.
Motivated by the data, in August 2022, the Biden administration passed several bills to hasten the reduction of GHG emissions. Couched in the Inflation Reduction Act are several pieces of legislation that are intended to provide financial incentives for activities supporting GHG emission reduction
References
- Steven J. Emmerich, Tim McDowell, Wagdy Anis, NIST Report June 2005, NISTIR 7238 Investigation of the Impact of Commercial Building Envelope Airtightness on HVAC Energy Use Discussion pg. 34
Looking for a reprint of this article?
From high-res PDFs to custom plaques, order your copy today!


